TL;DR
Build a flexible, AI-ready product analytics stack with Snowplow and Mitzu for precise event tracking, schema control, and powerful SQL-based insights. Use this comparison to evaluate tools through an agentic analytics lens: which platform enables an AI data analyst workflow with trusted SQL and a trusted semantic layer, not just faster dashboarding.
Use this comparison to evaluate tools through an agentic analytics lens: which platform enables an AI data analyst workflow with trusted SQL and a trusted semantic layer, not just faster dashboarding.
How to Build a Composable Product Analytics Stack with Snowplow and Mitzu?
Are you looking to set up a composable product analytics stack for your company? Well, you’ve come to the right place.
Here, we’ll teach you how to set up a composable product analytics stack using Snowplow and Mitzu. We’ll walk through the technical implementation of event tracking, schema evolution, and product metric modeling, including code snippets, schema examples, and architectural diagrams. This complements our recent webinar, "Designing a Composable Product Analytics Stack to Track Complex User Journeys", which you can watch here.
Whether you're looking to replace a packaged CDP or you're building a product analytics stack tailored to your data warehouse, this guide is for you.
Why Rethink Product Analytics?
Firstly, why does product analytics need a rethink?
For years, product teams have relied on tools like Mixpanel, Amplitude, and traditional Customer Data Platforms (CDPs) (e.g., Segment) as their default analytics stack. These platforms promise ease of use, featuring dashboards out of the box, prebuilt event taxonomies, and intuitive user interfaces.
But that convenience comes with real trade-offs for engineering and product teams that need precision, extensibility, and trust in their data.
Let’s break down the limitations, supported by real-world user reviews and technical breakdowns:
- Rigid event schemas: These tools often define event names and expected properties in advance, making it challenging to reflect product-specific logic (e.g., multi-step onboarding flows, progressive feature reveals, or domain-specific actions like quiz_completed or bundle_redeemed). Custom events exist, but retrofitting them into the platform’s logic often leads to naming inconsistencies, unused events, or developer workarounds.
- Opaque metric logic: Funnel steps, retention windows, and engagement definitions are often baked into the platform. You can customize them to an extent, but it isn’t easy to debug, extend, or version these definitions over time. If marketing and product define “active user” differently, the platform doesn’t help reconcile those discrepancies — it hides them.
- Sampling and aggregation: At scale, these platforms resort to data sampling, flattening of JSON structures, and pre-aggregated reporting to maintain performance. That works for directional insights but not for precision. Want to join your product metrics with customer support data or push granular events into an ML model? You’re stuck.
- Data extraction friction: Extracting raw event data from these tools, especially when enriched with context such as session information, device ID, or user traits, can require high-cost APIs or premium tiers. Feeding product usage data into a feature store or AI model can be a challenge, both technically and contractually.
This is where composable architectures shine.
What Is a Composable Product Analytics Stack?
In a composable product analytics stack, your team defines:
- How events are tracked
- How data is structured and validated
- How product metrics are calculated
- How data is used downstream
You don’t inherit someone else’s assumptions — you create a system that reflects your product, your users, and your business logic. This is especially critical if you’re supporting:
- Rapid product experimentation
- AI agent training and real-time personalization
- Deep behavioral segmentation for growth and retention efforts
This modularity allows engineering and product teams to:
- Keep data ownership
- Adapt the schema as the product evolves
- Define metrics directly in SQL or dbt
- Feed data into downstream applications, including AI agents
In short, a composable stack doesn’t just help you track users. It enables you to understand them and act on that understanding in a way that standard platforms weren’t built for.
Architectural Overview
Here’s how Snowplow and Mitzu integrate in a composable architecture:
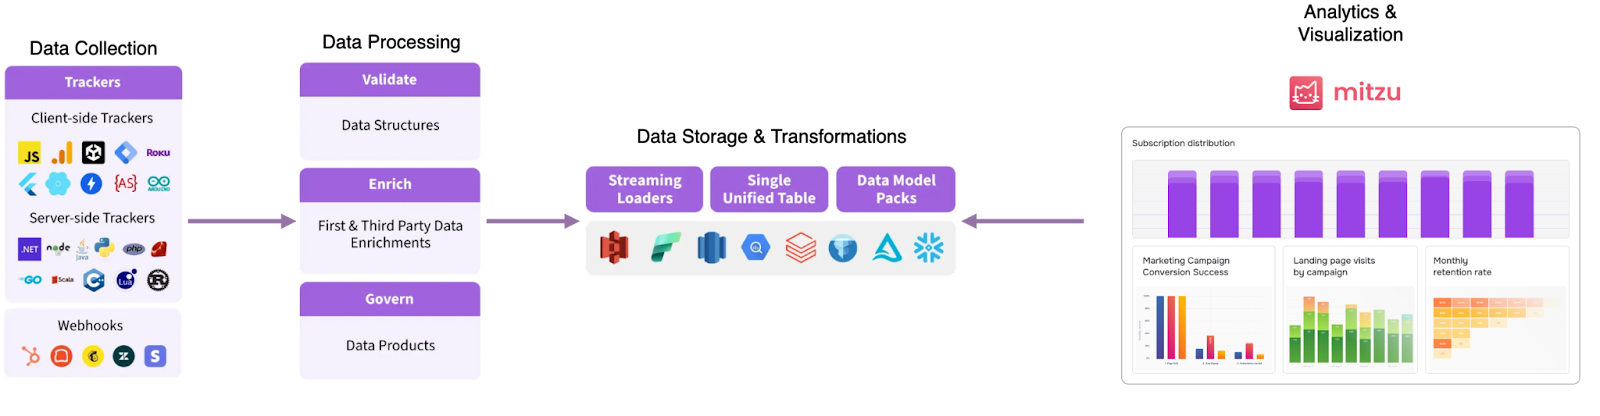
Each component is owned, scalable, and visible. Let’s describe the four elements of the implemented architecture:
- Data collection - this part of the Snowplow implementation resides on the frontend application, IoT device, backend service, or any system capable of tracking usage and behavioral events.
- Data processing, this part of the architecture with Snowplow, is responsible for validating and enriching the defined events, properties, and data products.
- Data storage & transformation Snowplow stores data in a data lake or data warehouse. In its raw format, the data is already usable. However, Snowplow offers various dbt data model packs for transforming data into different data products.
- Analytics & Visualization Mitzu is an independent software that connects to the data warehouse or data lake where Snowplow stores the raw or transformed data. Mitzu enables self-service product & marketing analytics over Snowplow datasets.
Deep Dive: Technical Implementation
Now, let’s break down how actually to implement tracking and modeling in this setup.
Step 1: Implementing Snowplow Trackers
Start with Snowplow’s JavaScript Tracker or SDKs (iOS, Android, server-side). Place the tracker in your app or website (see here for full instructions).
snowplow('newTracker', 'sp', '{{collector_url_here}}', {
  appId: 'my-app-id',
});
snowplow('trackPageView');
This will track the page view event and lets you configure the out-of-the-box events and entities that you wish to track.
Step 2: Implementing Data Products and Schema Validation
Additionally, you can define your events and entities to capture specific events within your application. Snowplow Data Product Studio lets you create schemas for your events and entities and represent your data products.
Step 3: Generate the tracking code using Snowtype
To track events using the defined schemas, you can generate the tracking code automatically using Snowtype or define your own tracking code such as in the following example:
snowplow('trackSelfDescribingEvent', { event: { schema: 'iglu:com.acme_company/viewed_product/jsonschema/1-0-0', data: { productId: 'ASO01043', category: 'Dresses', brand: 'ACME', returning: true, price: 49.95, sizes: ['xs', 's', 'l', 'xl', 'xxl'], availableSince: new Date(2013,3,7) } } });Step 4: Event CollectionThe browser sends this event to the Snowplow Collector (e.g., collector.acme.com).The collector receives and packages events for downstream processing.Step 5: Validation & EnrichmentValidation: The event is checked against its schema (via Iglu). If it doesn't match, it’s routed to a bad event stream.Enrichment: Contextual information is added, like user agent parsing, geo-IP lookup, or marketing campaign data.This all happens in the Enrichment process, typically powered by Stream Enrich (for real-time) or Batch Enrich (for periodic jobs).
Step 6: Real-Time or Batch Processing
Option A: Real-Time Stream
- The enriched event flows into a Kafka, Kinesis, or Pub/Sub stream.
- From there, you can:Feed a real-time streaming warehouse (e.g., Snowflake via Snowpipe Streaming, BigQuery, or Redshift).
- Trigger real-time customer interventions or ML scoring.
Option B: Data Lake / Cloud Storage
- Events are written to S3, GCS, or Azure Blob.
- Data is typically stored in structured formats (like JSON or Parquet).
- Often used for large-scale historical analysis or ML training.
Option C: Data Warehouse
- Use a loader (e.g., Snowplow’s Snowflake Loader, Redshift Loader, BigQuery Loader) to push enriched events into your warehouse.
- Events are stored in atomic tables, including their entire structure, schema context, and timestamped history.
Introducing Mitzu for Product & Marketing Analytics
Mitzu is purpose-built to help product teams define, modify, and analyze metrics directly in the warehouse, eliminating the need to write SQL queries manually for product and marketing analytics use cases.
It connects to your warehouse (E.g., Snowflake, BigQuery, Databricks) and can utilize event data from Snowplow.
Building Blocks of Mitzu
In Mitzu, users can analyze customer journeys, conversion rates, product stickiness, retention rates, churn rates, and many other key metrics.
The core concept of the application is the insight. Insights can be of four categories:
- Segmentation
- Funnel
- Retention
- Journey
With the four insight categories, product and marketing managers can self-serve to answer most of their questions from the data warehouse and Snowplow data.
Step 7: Integrate Mitzu with Your Data Warehouse
Mitzu can connect to most modern cloud data warehouses and lakes. The most common are:
- Snowflake
- Databricks
- BigQuery
- Clickhouse
- AWS Redshift
After establishing the direct connection between Mitzu and the data warehouse, the user must select the tables where Snowplow events are collected.
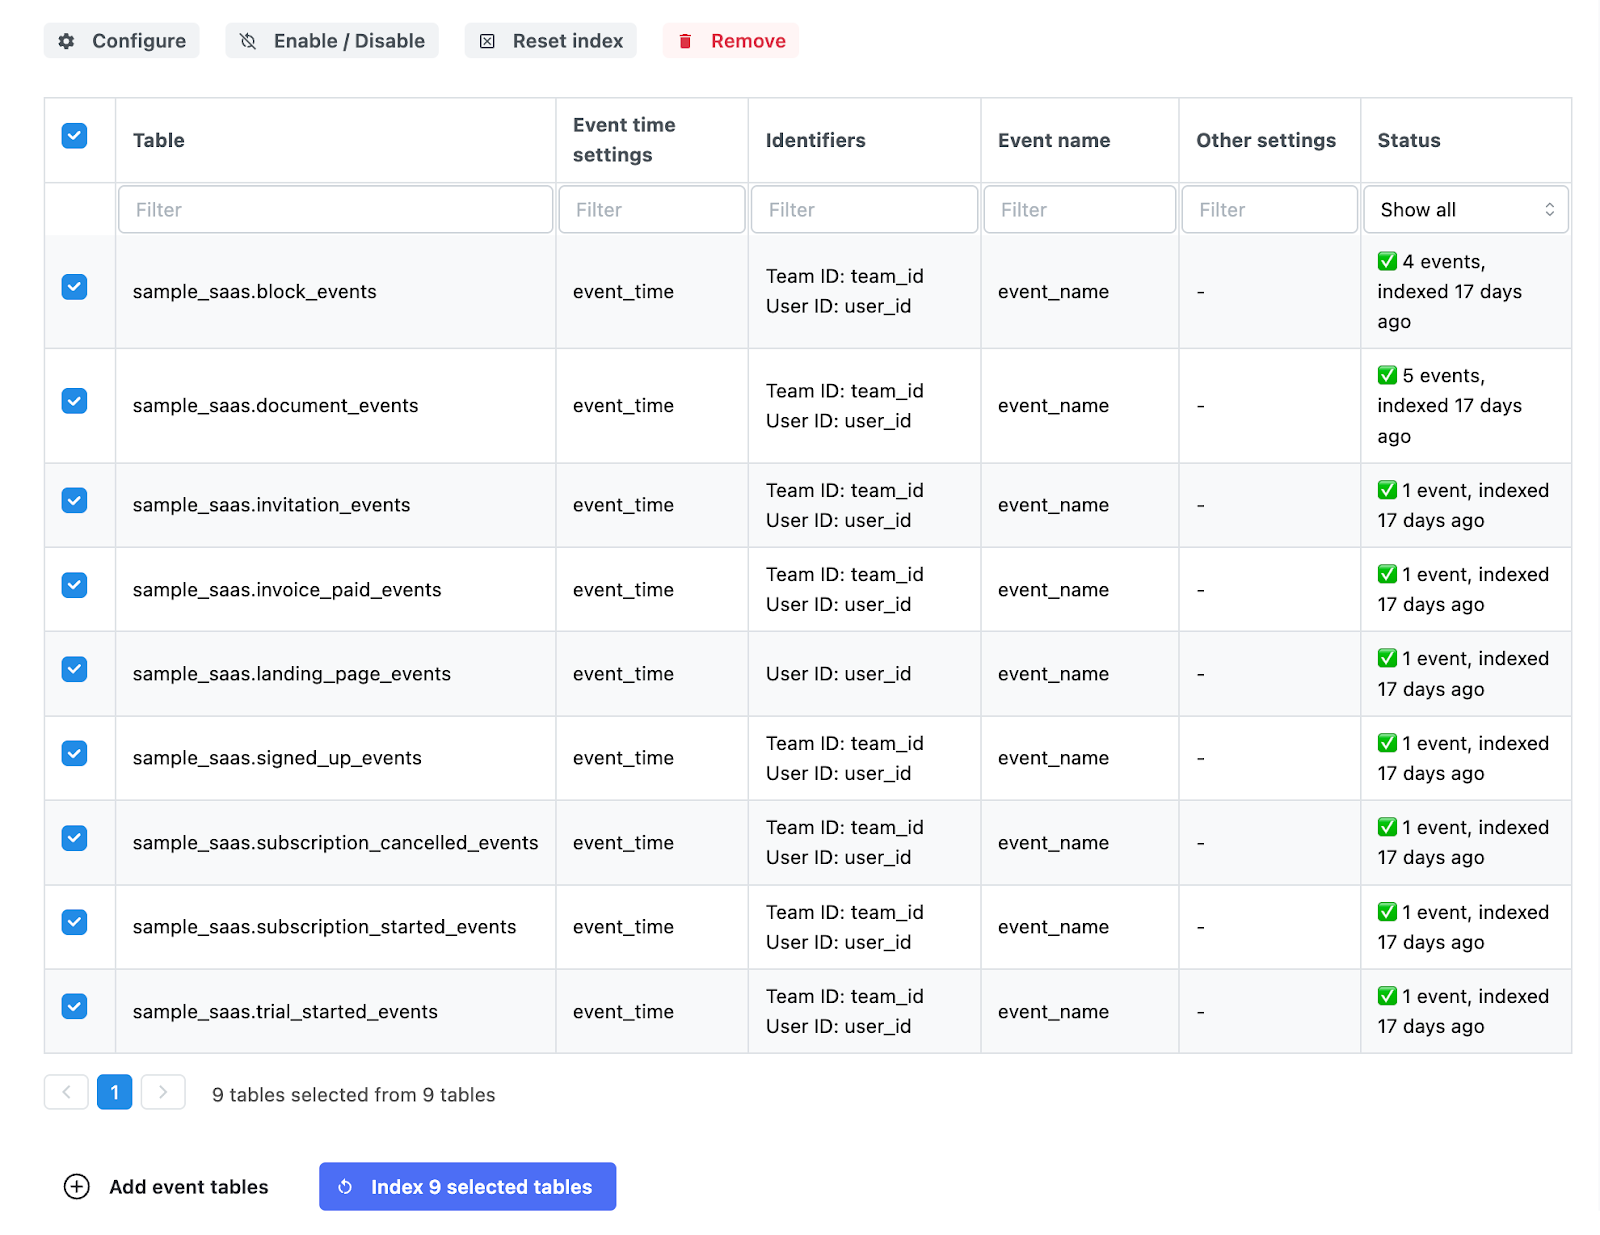
In general, Mitzu supports star schema (facts and dimension tables), which corresponds to what Snowplow creates. For simplicity in this case study, I will only focus on fact (event) tables.
Once the user adds the event tables, they are indexed to create the events and properties catalog. This process may take a few minutes, but is crucial for the application's usability.
Step 8. Composable Analytics without Data Moving
Indexing the tables only selects a small sample from each table. With these samples, Mitzu creates the event and properties catalog. In the catalog, you will find the same events and properties that you have captured via the Snowplow SDKs at Step 3.
By periodically running the indexing, Mitzu ensures that the events and properties correspond to the data present in the data warehouse tables.
The integration process, featuring a direct warehouse connection and table indexing, enables the creation of composable product and marketing analytics. Traditionally, product and marketing analytics have always required data transfer to a third-party solution.
The second enabler for composable product analytics is the recent improvement in data warehouse and lake technologies (e.g., Iceberg, Delta, Snowflake), which enable the separation of storage and computation.
The computation engine has become so efficient in recent years that analyzing large volumes of data directly in the data lake can be more performant than moving it to a third-party dedicated solution.
What Enables SQL-Based Product Analytics?
For a product or marketing analyst, the most critical SQL query to master is the funnel query.
The funnel SQL query can answer questions such as churn rates, identifying drop-offs in the product, user retention rates, and which campaign converts the most users, among other key metrics. These queries work on top of the Snowplow events in the event tables.
The traditional SQL approach, which is based on LEFT JOINS, falls short in performance compared to dedicated 3rd party tools. However, the revolution in recent years that appeared in data lake computation enables a much more performant version of the funnel SQL query. This is based on UNION ALL and window functions. (Example below).
The problem with LEFT JOINS for funnel analytics is that the JOIN often causes a disk spill, as the Cartesian product leads to filling the cluster’s memory. The Cartesian Product uses O(N^2) space and CPU complexity.
The spill is significantly less likely to occur with UNIONS and window functions, as the space complexity of UNION ALL remains O(N). The computation with window functions is O(n*log(n)), which is due to the sorting that occurs in window functions. Mitzu’s chosen window function for funnel SQL queries is FIRST_VALUE or LEAD, depending on the data warehouse technology. A detailed explanation of these SQL queries is outside the scope of this case study. However, you can read about this topic here.
Below, you can find a typical visitor Conversion Rate calculation using left joins, and below that, the solution window functions. The two queries yield the same percentage of results. However, the real-life time-to-results of the window function-based funnel queries is 80% shorter. In other words, window-function-based funnel SQL queries can be 4 times faster in real-life scenarios.
LEFT JOIN-based funnel query:
WITH page_visits AS (
  SELECT event_time, user_id
  FROM events
  WHERE event = 'page_visit'
),
payments AS (
  SELECT event_time, user_id
  FROM events
  WHERE event = 'payment'
)
SELECT
  DATE(t1.event_time) AS day,
  COUNT(DISTINCT t1.user_id) * 100.0 / NULLIF(COUNT(DISTINCT t2.user_id), 0) AS conversion_rate
FROM page_visits t1
LEFT JOIN payments t2
  ON t1.user_id = t2.user_id
  AND t2.event_time > t1.event_time
  AND t2.event_time <= t1.event_time + INTERVAL '1' DAY;

        WITH all_events AS (
  SELECT user_id, event, event_time
  FROM events
),
conversion_times AS (
  SELECT
  user_id,
  event,
  event_time AS event_time_1,
  CASE
    WHEN event = 'page_visit' THEN
      LEAD(CASE WHEN event = 'payment' THEN event_time END) IGNORE NULLS OVER (
        PARTITION BY user_id
        ORDER BY event_time ASC
      )
    ELSE NULL
  END AS event_time_2
  FROM all_events
),
filtered_conversions AS (
  SELECT
  user_id,
  event_time_1,
  CASE
    WHEN event_time_2 <= event_time_1 + INTERVAL '1' DAY THEN user_id
    ELSE NULL
  END AS converting_user_id
  FROM conversion_times
  WHERE event = 'page_visit'
)
SELECT
  DATE(event_time_1) AS day,
  COUNT(DISTINCT user_id) * 100.0 / COUNT(DISTINCT converting_user_id) AS conversion_rate
FROM filtered_conversions;

/*
The window function-based funnel queries are the key component to enable semantic-layer grounded product and marketing analytics on datasets of virtually any size.
*/
Iceberg & Delta Lakes
In addition to enhancements in data warehouse features, such as support for window functions, the most significant advancement in recent years has been the adoption of Iceberg and Delta tables.
These table formats not only introduce ACID transactions to data lakes but also offer powerful tools to boost read performance. By combining partitioning with clustering techniques (e.g., Z-Ordering in Delta Lake), analytical queries for product and marketing use cases can be executed more efficiently.
Step 9: Creating Insights in Mitzu
As mentioned above, the building blocks of Mitzu are Insights. These enable non-techy users to answer the most common questions with just a few clicks.
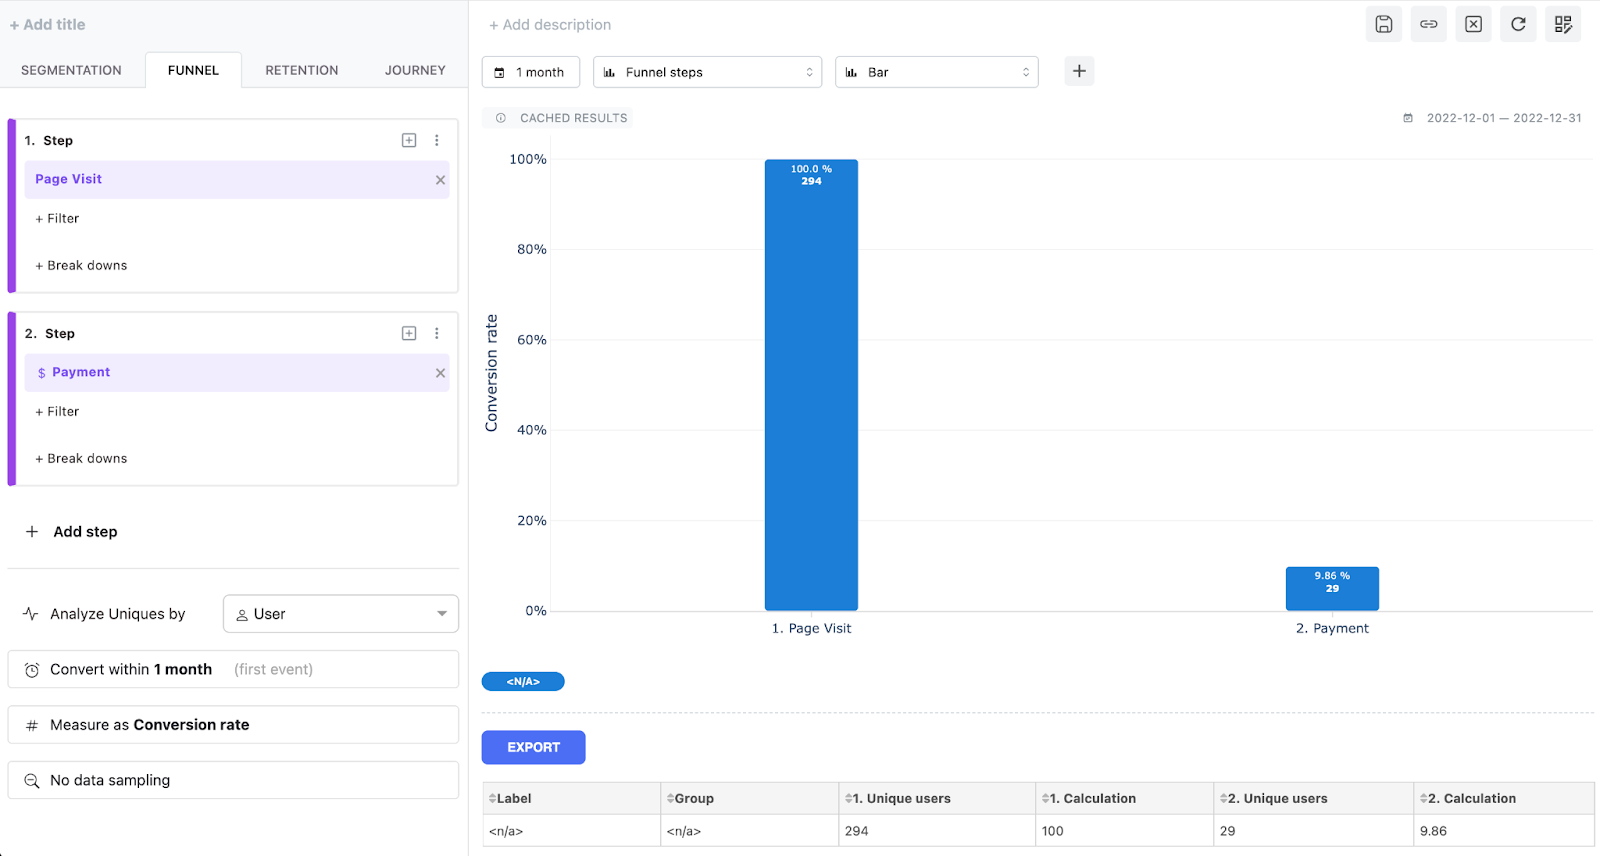
Let’s create our first funnel insight in Mitzu.
Let's take the following use case. As a marketing expert, you would like to understand how much revenue your most recent campaign generates on your e-commerce website.
Let’s assume you already have Snowplow event collection set up, you already store your events in Snowflake, Mitzu is integrated with the Snowflake tables, and the tables are all indexed.
You need to do the following to answer your analytical questions in Mitzu:
- Select the Funnel tab on Mitzu’s insights page.
- Select the PAGE_VISIT as the first event
- Filter for your desired campaign value for the UTM_CAMPAIGN property.
- Select the PAYMENT event for the second step
- Select a 1-month conversion window at the funnel configuration dialog.
- Click the “Run” button.
This will execute the automatically generated SQL query, which is based on UNION ALL and the FIRST_VALUE window function. In a medium-sized Snowflake cluster, this query can complete within 5 seconds for even 100 million PAGE_VISIT events.
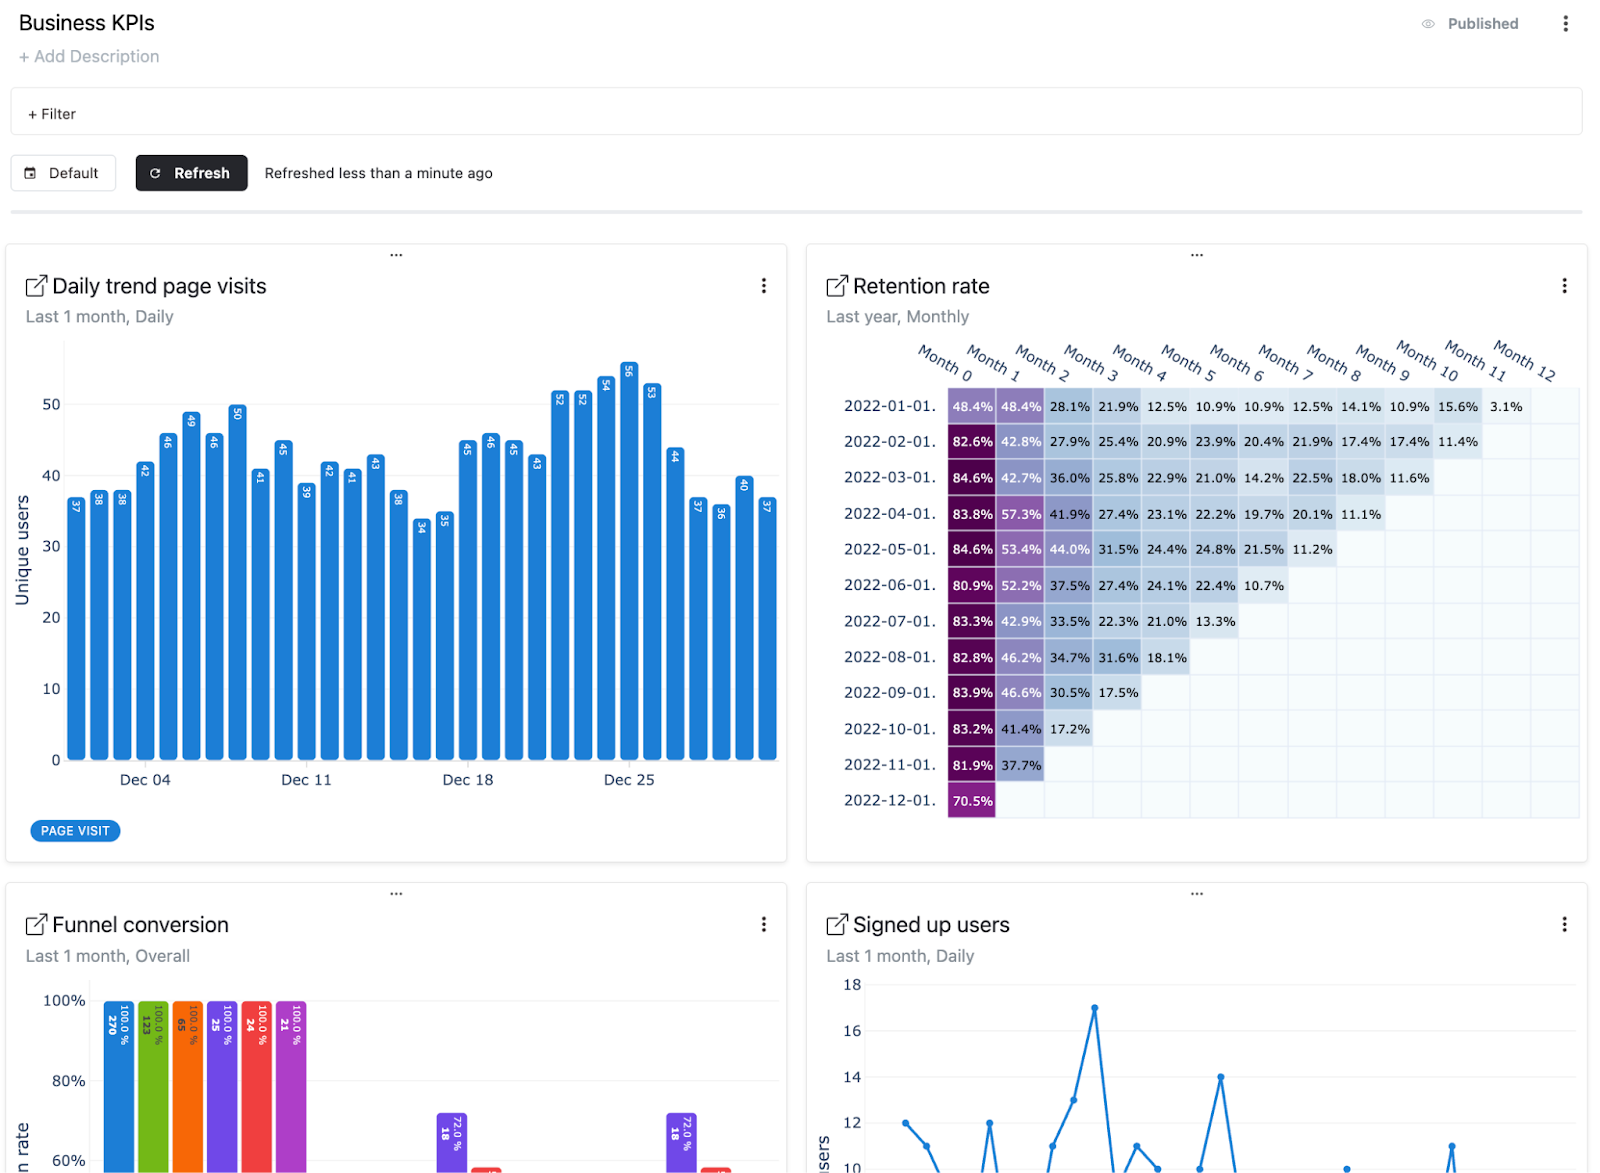
Step 10: Assembling Insights to Dashboards
As you have seen, creating insights in Mitzu is straightforward. It is even simpler to organize your insights and metrics into Dashboards and share them with your colleagues.
Dashboards enable automatic refreshes on the charts. With this feature, you and your colleagues can track your KPIs over time.
Dashboards also allow for further filtering on event properties. This is a great feature that will enable you to drill down to business metrics and KPIs simultaneously.
How This Approach Sets You Up for AI?
By structuring your product analytics stack with clean, validated event-level data:
- Your product metrics are AI-ready (no reprocessing needed)
- You can train or fine-tune AI agents on rich user journey data
- You enable predictive modeling, like churn, LTV, or recommendation engines
It also avoids the lock-in of black-box platforms, giving your team freedom to evolve.
Conclusion: Clean In, Clean Out
Designing your analytics stack with Snowplow and Mitzu allows you to take full control over both collection and modeling. You gain transparency, flexibility, and future-proofing, whether you're looking to optimize current product flows or prepare your data stack for AI-driven experiences.
Want to see it in action? Watch the full webinar here or reach out to our teams to explore how you can get started.
FAQ
What analytics question does this article answer?
It connects business or product outcomes to the metrics, segments, and semantic-layer grounded patterns teams use so stakeholders do not debate methodology in every meeting.
What should leaders prioritize first?
Stabilize definitions for key events and KPIs, ensure funnels and retention can be reproduced from the warehouse, then expand self-serve and automation on top of those truths.
How does AI or agentic analytics fit here?
Agents work best when prompts and answers map to governed models. Read AI analytics for how that differs from chat that ignores warehouse semantics.