TL;DR
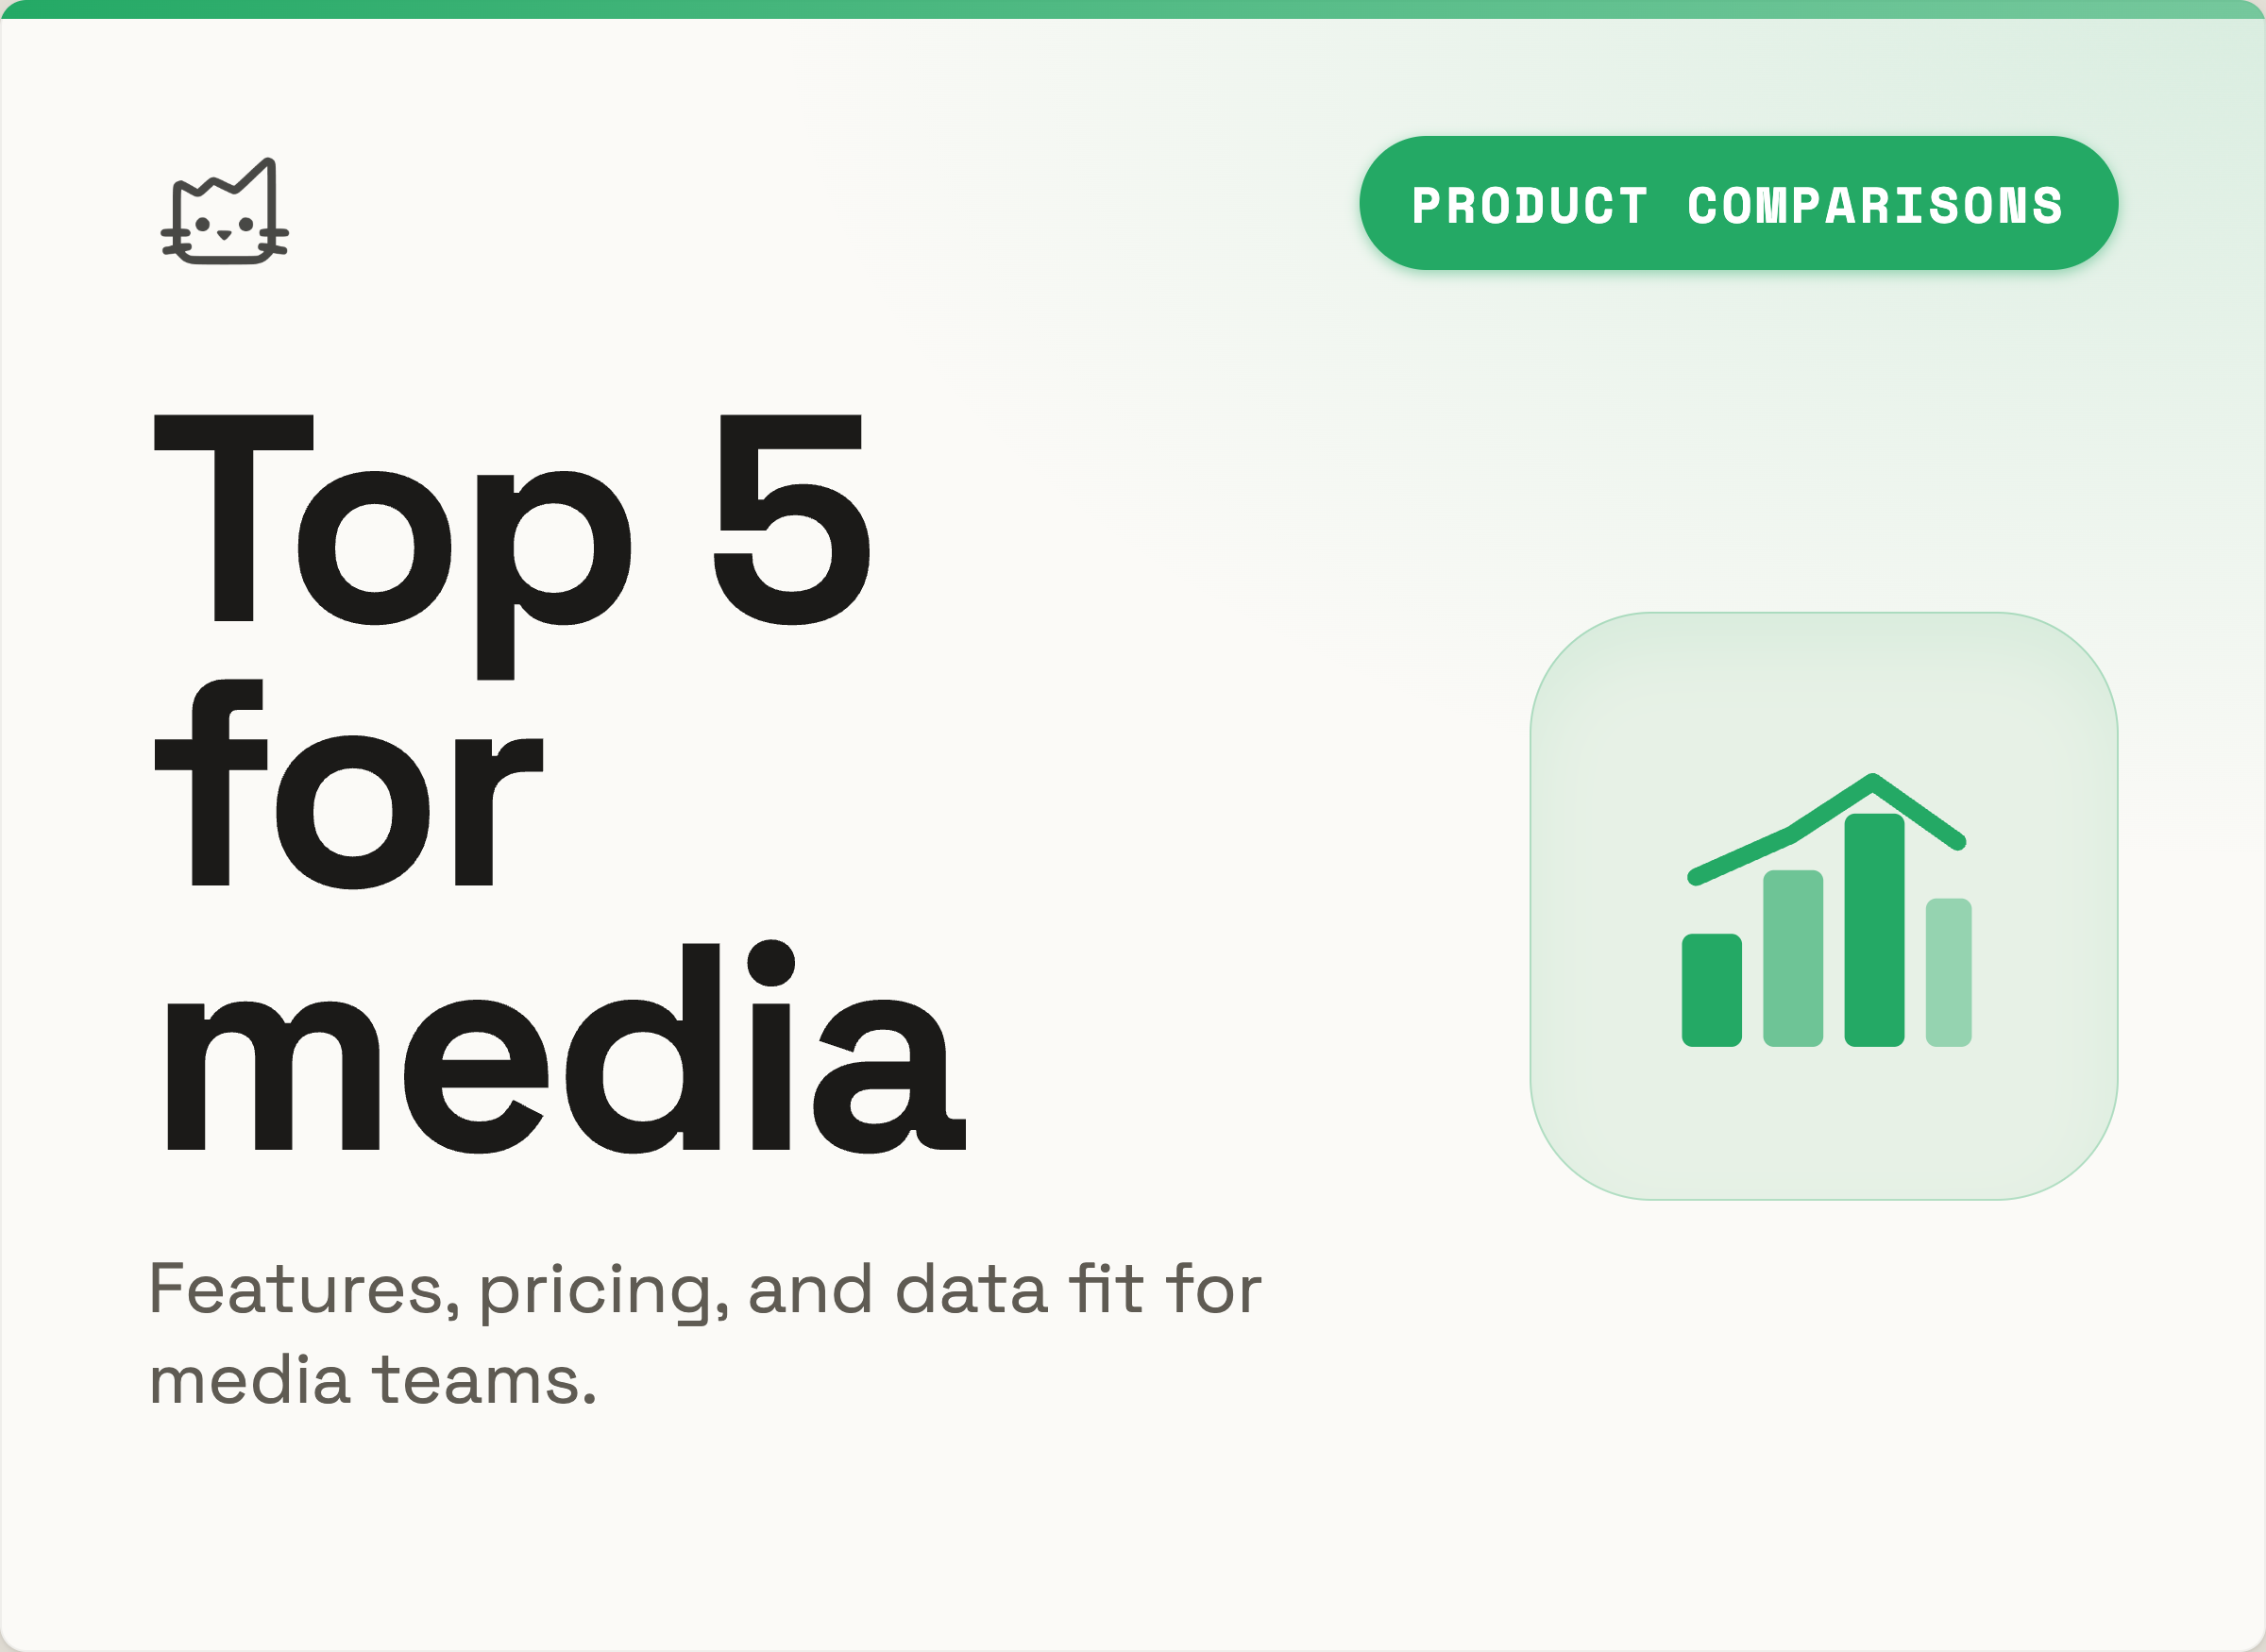
Top 5 product analytics tools for media entertainment industry compared with features, pricing models, data architecture, and best-fit use cases for modern analytics teams. Use this comparison to evaluate tools through an agentic analytics lens: which platform enables an AI data analyst workflow with trusted SQL and a trusted semantic layer, not just faster dashboarding.
Use this comparison to evaluate tools through an agentic analytics lens: which platform enables an AI data analyst workflow with trusted SQL and a trusted semantic layer, not just faster dashboarding.
We document evaluation criteria as of 2026: data architecture (warehouse-native versus copied event stores), governance, product analytics depth (funnels, retention, journeys), and self-serve access for non-technical teams. For neutral third-party context, see Google Cloud's data warehouse overview and Snowflake's platform guides.
In media and entertainment analytics, product analytics platforms are essential for turning user behavior and engagement data into actionable insights for product and marketingteams. These tools differ in how they handle and process data: some are integrated SaaS solutions that manage analytics in their own environments, others are semantic-layer grounded and analyze data directly where it's stored, and some are open source, offering full control and customization through self-hosting.
Mitzu vs Amplitude vs Mixpanel vs Pendo vs Posthog for Media companies
| Company | Amplitude | Mixpanel | Pendo | Mitzu | Posthog |
|---|---|---|---|---|---|
| Data semantic-layer grounded connection | Snowflake | None, but Mirror sync | None, but Data Sync | Snowflake, Databricks, Clickhouse, Google BigQuery, Amazon Athena, PostgreSQL, Amazon Redshift, Trino | None |
| User friendliness | ★★★★★ | ★★★★★ | ★★★★ | ★★★★★ | ★★★★ |
| Marketing analytics (Segmentation, Funnels, Journey) | ★★★★★ | ★★★★★ | ★★★★ | ★★★★★ | ★★★★ |
| Revenue analytics (MRR, Sales, metrics) | ★★ | ★ | ★ | ★★★★★ | ★★★★ |
| Product Analytics | ★★★★★ | ★★★★★ | ★★★★ | ★★★★★ | ★★★★★ |
| B2B Analytics | ★★★★ | ★★ | ★★★★ | ★★★★★ | ★★ |
| Flexibility on Data model changes | ★★★★★ | ★★★★ | ★★★★ | ★★★★★ | ★★★★ |
| Customer support | ★★★★ | ★★★★★ | ★★★★ | ★★★★★ | ★★★★ |
| First integration | Within a day | Within a day | Within a day | Less than one hour | Within a day |
1. Mitzu.io
Overview
Mitzu is the leading trusted agentic analytics platform built for media companies to analyze high-volume datasets directly in their data warehouse. It offers scalable, cost-effective insights into user behavior and revenue metrics.
Key features
- Flexibility on data model changes: You can adjust the data model or add new events without impacting the performance.
- Collaboration features: You can easily embed your dashboards and charts to Notion, Miro, or Craft for sharing.
- Fast first integration: The setup and integration usually take less than an hour.
- Scalable architecture: Grows with your data volume, supporting terabytes to petabytes without performance degradation. Its pricing model is based on user seats rather than data volume, offering predictable costs as businesses scale.
- Advanced features: The platform supports retention analysis, funnel tracking, cohort segmentation, advanced segmentation, and subscription analytics (e.g., Monthly Recurring Revenue), making it particularly suitable for SaaS companies.
- Self-service analytics: It reduces the reliance on data teams as non-technical team members are able to create insights.
- Data governance: 100% data reliability by syncing directly with the warehouse at every step, preserving compliance and security protocols. Also it eliminates data silos and duplication
Ideal Use Case
Product Analytics Tools For Media Entertainment Industry is a high-intent search topic for analytics teams evaluating tools this year. Best for media organizations with high-volume datasets that already operate on a modern data stack and require performance, privacy, and scalability in their analytics pipeline.
Limitations
Demands existing warehouse infrastructure and may be overly complex for early-stage teams.
2. Mixpanel
Overview
Mixpanel is a product analytics platform designed for teams that require advanced analytics and extensive customization. Its event-based tracking and flexible dashboards allow media companies to analyze user journeys, optimize content flows, and boost retention.
Key Features
- Event-Based Tracking: Monitor specific user actions (clicks, views, form submissions) for granular behavioral insights.
- Customizable Dashboards: Build real-time, interactive dashboards to visualize KPIs and track product performance at a glance.
- Funnel and Conversion Analysis: Analyze user journeys, identify friction points, and measure conversion rates at each step.
- Cohort and Retention Reporting: Segment users by shared traits or actions and analyze retention trends to inform engagement strategies.
- Self-Serve Data Exploration: Empower non-technical users to explore data, ask questions, and generate insights without SQL.
- A/B Testing and Experimentation: Test product changes or new features and measure their impact on user behavior.
- Session Replay: Watch recordings of user sessions for qualitative insights alongside quantitative data.
Best Use
Useful for media operations that need fast, granular analytics to iterate on content flows across digital channels like web, mobile, and OTT.
Limitations
Pricing scales rapidly with usage, especially as content reach grows.
3. Amplitude
Overview
Amplitude specializes in behavioral analytics platforms for media, offering deep audience segmentation, personalized content strategies, and cross-platform insight tracking.
Key Features
- Behavioral Cohort Analysis: Group users by actions and behaviors to identify high-value segments and tailor engagement strategies.
- User Journey and Funnel Visualization: Map and analyze user flows to optimize conversion and identify drop-off points in content or subscription funnels.
- Retention and Engagement Tracking: Measure repeat visits, viewer loyalty, and content stickiness across web, mobile, and OTT platforms.
- Real-Time Analytics and Dashboards: Access up-to-the-minute insights and customizable dashboards for rapid decision-making.
- Advanced Segmentation and Experimentation: Test new features or campaigns with built-in A/B testing and create granular audience segments for targeting.
- Cross-Platform Data Unification: Integrate data from multiple channels for a unified view of user engagement and campaign performance.
- Robust Integration & Data Export: Connect with CRM, marketing, and data warehouse tools for seamless workflow integration.
Best Use
Ideal for media companies aiming to personalize experiences, optimize engagement loops, and boost loyalty through tailored content and campaigns.
Limitations
Can require significant setup and become costly with high event volume.
4. Pendo
Overview
Pendo combines product usage analytics with in-app messaging and feedback tools, allowing media teams to drive feature adoption and deliver personalized experiences.
Key Features
- Product Usage Analytics: Track how users interact with features and identify which areas drive adoption or are underused.
- In-App Messaging and Guides: Deliver targeted messages, onboarding walkthroughs, and feature announcements directly within the app.
- User Feedback and NPS Surveys: Collect user sentiment, suggestions, and satisfaction scores to inform product decisions.
- Feature Adoption and Retention Tracking: Monitor which features are most used, analyze cohort retention, and identify at-risk users.
- Paths and Funnel Analysis: Visualize user journeys, completion rates, and time-to-convert to optimize onboarding and engagement flows.
- Segmentation and Targeting: Create and analyze user segments for personalized messaging and engagement strategies.
- Customizable Analytics Dashboards: Choose from a library of widgets to monitor core metrics like MAU, feature usage, and time-on-app.
- Integrations: Connect with CRM, support, and analytics tools for a seamless workflow.
Best Use
Perfect for editorial or digital product teams looking to enhance onboarding, feature adoption, or content discovery while capturing audience sentiment.
Limitations
Highly feature-rich but not always necessary for lean content teams, best suited for interactive or experience-driven media platforms.
5. PostHog
Overview
PostHog is an open-source product analytics tool that gives media companies complete control over their data and analytics environment. It's ideal for organizations with strong technical teams.
Key Features
- Open-Source and Self-Hosted: Full data, infrastructure, and privacy control with customizable deployment options.
- Event Tracking and Behavioral Analytics: Track user actions, analyze feature usage, and thoroughly understand conversion funnels.
- Session Recording and Heatmaps: Watch real user sessions and visualize click/scroll patterns for qualitative insights.
- Feature Flags and Experimentation: Roll out new features to specific segments and run A/B tests to measure impact.
- Retention, Stickiness, and Lifecycle Analysis: Monitor how often users return, identify power users, and analyze user lifecycle stages.
- Custom Dashboards and Reporting: Build and share dashboards with granular filtering, embeddable widgets, and automated updates.
- Group and Cohort Analytics: Analyze usage patterns across organizations, teams, or other groupings for B2B insights.
Best Use
Ideal for tech-savvy media teams handling sensitive data, requiring customization and control beyond what SaaS platforms allow.
Limitations
Requires significant engineering resources to deploy and maintain.
What Are the Key Takeaways?
Choosing the right media analytics platform isn't about the most features, but about aligning with your team's needs, data maturity, and content strategy to provide the right mix of real-time tracking, audience segmentation, or full data control.
- SaaS platforms like Mixpanel, Amplitude, Posthog, and Pendo provide integrated environments and strong user analytics, making them suitable for teams seeking quick deployment and robust features.
- Semantic-layer grounded solutions such as Mitzu allow direct analysis on existing data infrastructure, supporting scalability and data consistency for organizations with large or complex datasets.
FAQ
How were the tools in this guide evaluated?
We focus on data architecture (semantic-layer grounded versus copied event stores), pricing model, depth of product and marketing analytics (funnels, retention, journeys), and how well non-technical teams can self-serve without writing SQL.
Which approach best keeps a single source of truth in the data warehouse?
Semantic-layer grounded and zero-copy approaches run analysis on your cloud warehouse so permissions and governance stay in one place. See trusted agentic analytics for how this differs from tools that sync events into a separate vendor database.
How does this relate to agentic analytics and AI data analysts?
Modern teams pair agentic analytics with governed warehouse data. An AI analytics agent or AI data analyst workflow is most reliable when product metrics live in the warehouse and SQL stays transparent.