TL;DR
Product Analytics is crucial for product managers, marketing professionals, and business leaders. analytics products are for historical, aggregated data for comprehensive business analysis.
Use this comparison to evaluate tools through an agentic analytics lens: which platform enables an AI data analyst workflow with trusted SQL and a trusted semantic layer, not just faster dashboarding.
We document evaluation criteria as of 2026: data architecture (warehouse-native versus copied event stores), governance, product analytics depth (funnels, retention, journeys), and self-serve access for non-technical teams. See dbt's analytics engineering docs and Google Cloud's warehouse primer for methodology alignment.
We often hear this question from SaaS and e-commerce companies aiming to improve data-driven decision-making.
“Are they basically the same thing or totally different beasts? Is Product Analytics just a part of analytics products? Do we really need to bother with Product Analytics too? What extra edge does bringing in Product Analytics give us?”
In the world of data-driven decision-making, understanding the distinct roles of Business Intelligence (analytics) and Product Analytics is crucial for product managers, marketing professionals, and business leaders. While business intelligence and analytics products are instrumental to use the power of data, their applications and impacts differ significantly. This article aims to demystify these two fields, offering insights into their unique characteristics and how they complement each other in a modern business environment.
Business Intelligence (analytics):
This traditional discipline focuses on analyzing historical data to guide business decisions. analytics products encompasses various activities, including data mining, online analytical processing, querying, and reporting. Tools like Tableau and Power analytics are commonly used to visualize complex data from various sources such as sales, finance, and customer service, providing a comprehensive view of the organization's performance.
Product Analytics:
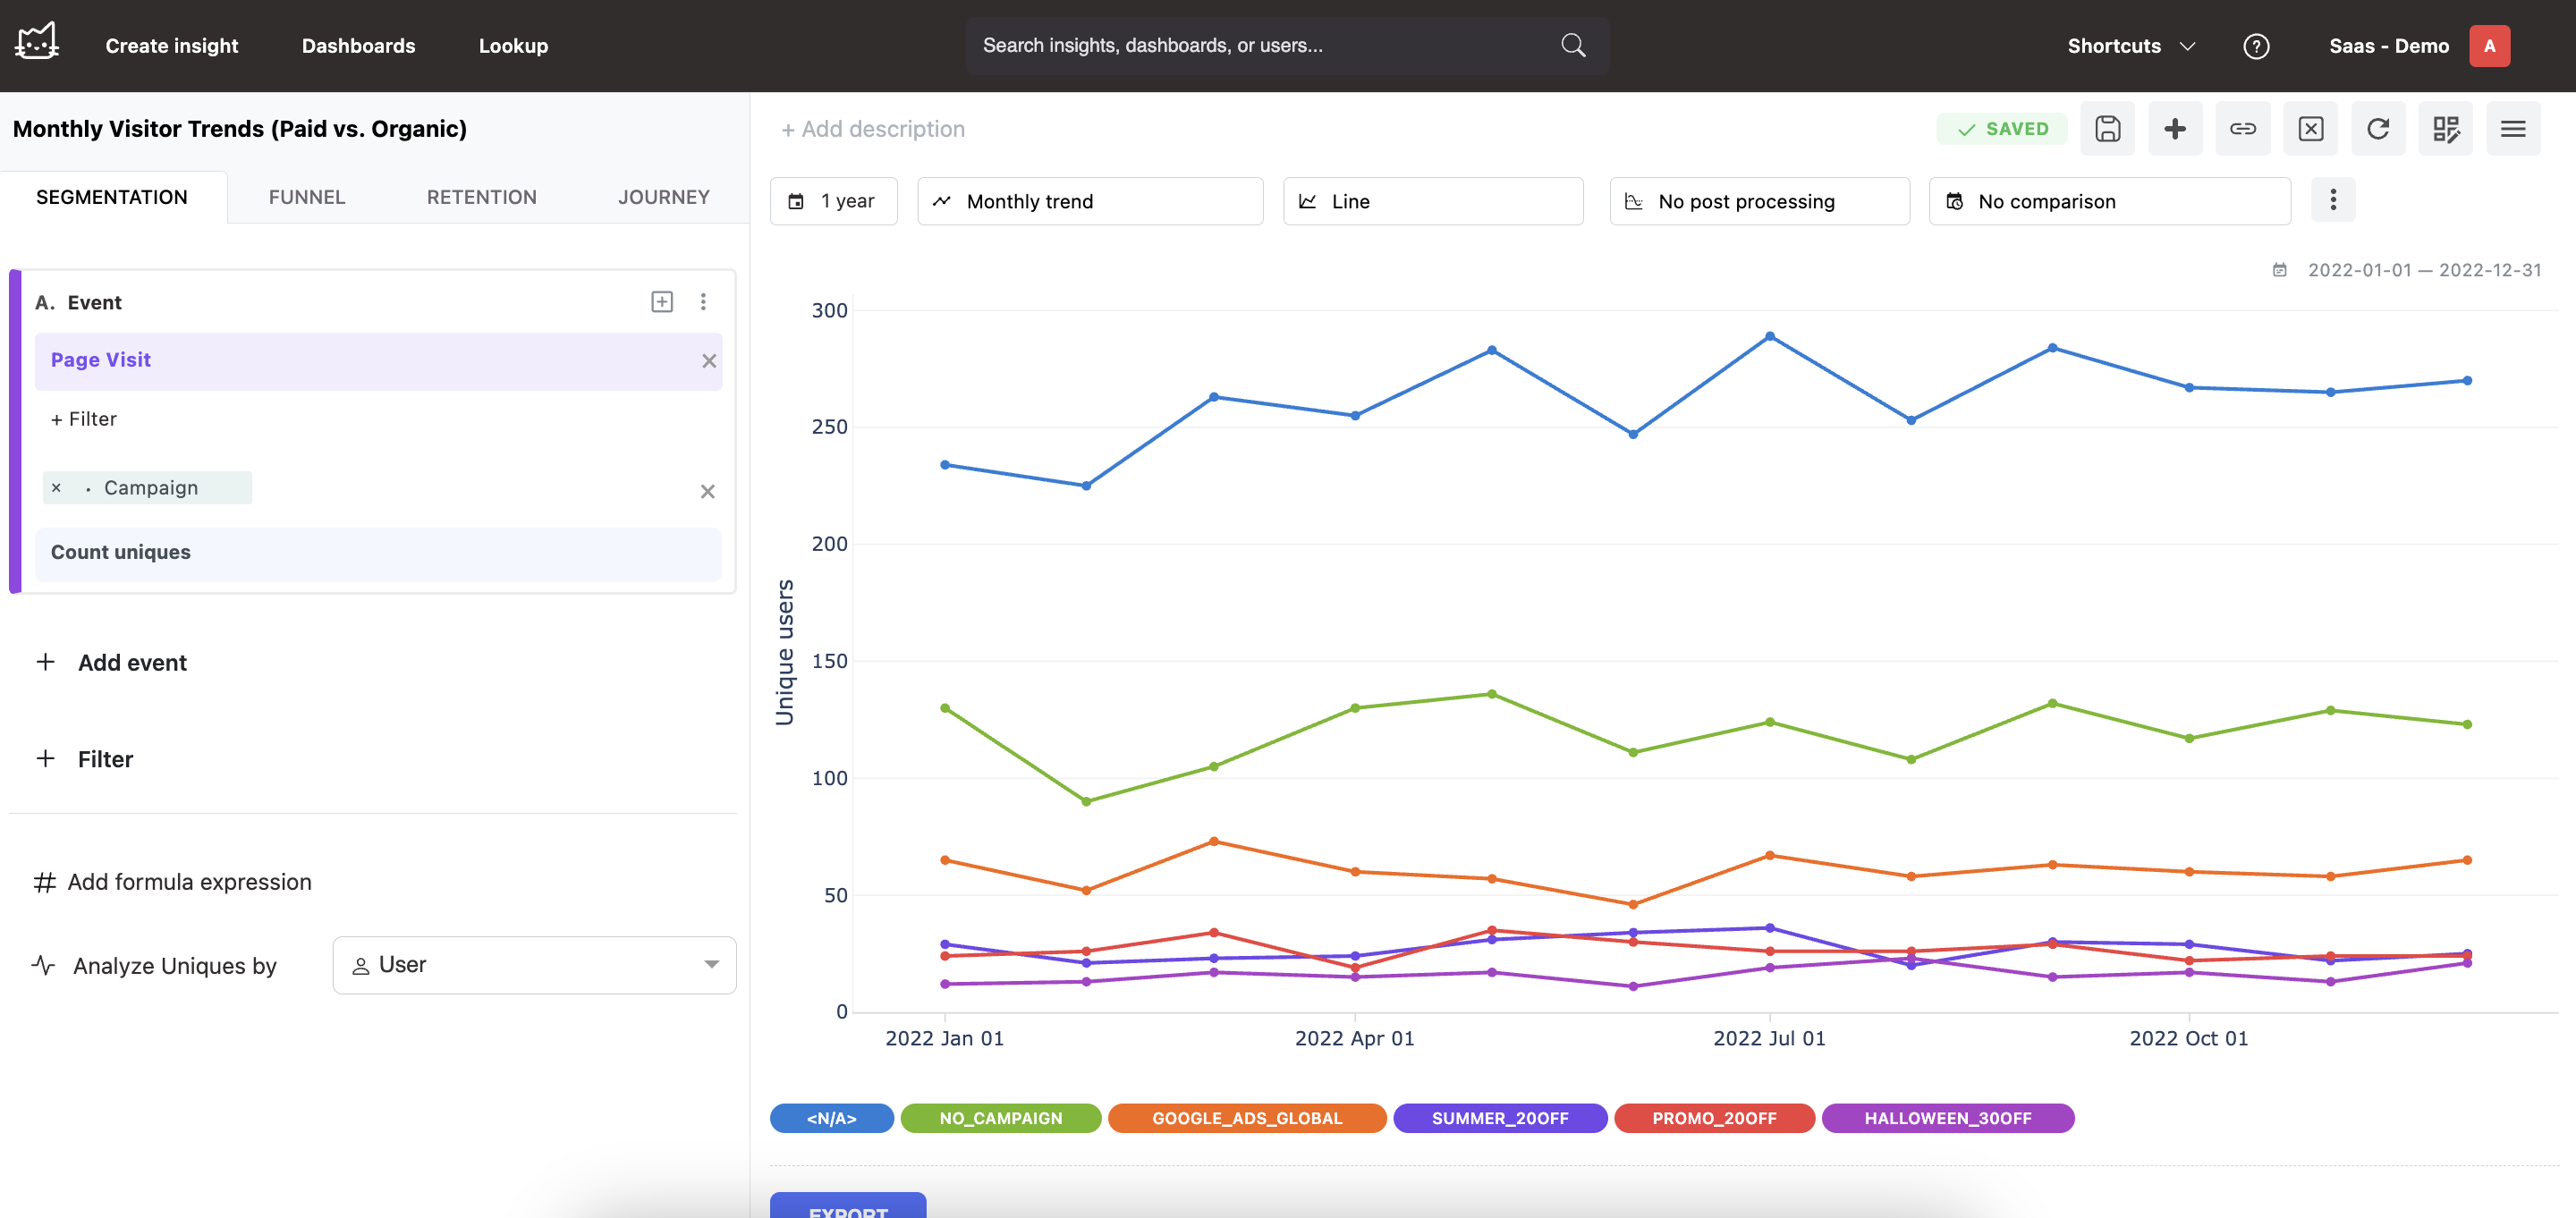
A newer domain, Product Analytics, is centered on the real-time analysis of how users interact with digital products. It involves tracking and examining user behavior, feature usage, and engagement within apps, websites, or online platforms. Tools like Mitzu and Amplitude help businesses to monitor user journeys, identify patterns, and make data-informed decisions to enhance product design and user experience.
What’s the difference between Business Intelligence and Product Analytics?
| Aspect | Business Intelligence (analytics) | Product Analytics (PA) |
|---|---|---|
| Definition | Analyzes overall business performance via historical and financial data. | Tracks user behavior and product use to improve engagement and features. |
| Saas example | Monitors revenue, CAC, churn, and regional team output. | Measures feature adoption, onboarding friction, and UI test results. |
| E-commerce example | Reports sales, margins, and inventory turnover. | Tracks drop-offs, optimizes checkout, and personalizes recommendations. |
| Scope | Macro, company-wide. | Micro, user-level. |
| Data | Aggregated, historical. | Real-time, event-based. |
| Metrics | Revenue, CAC, LTV, churn. | DAU/MAU, retention, funnels, adoption. |
| Users | Executives, ops, finance. | Product, UX, marketing, dev teams. |
| Output | Dashboards, reports, KPIs. | Event tracking, journeys, cohorts, A/B tests. |
| Integration | analytics sets the strategic context. | PA explains why metrics move together as they connect business and product insights. |
Business Intelligence
Definition and scope
Business Intelligence (analytics) refers to the process of analyzing data from multiple sources to guide company-wide strategies and decision-making. I’ve collected the top 6 business intelligence tools to help organizations get a complete, strategic view of their performance.
Key features:
- Wide-Ranging Data Analysis: Integrates data from sales, marketing, finance, operations, and more.
- Visual Reporting and Dashboards: Translates complex data into easily digestible visual formats.
Advantages & Challenges:
- Strategic Decision Support: Facilitates informed decisions across various business functions.
- Broad Organizational Insight: This offers a holistic view of the company's performance and potential areas for improvement.
- Lack of Product-Specific Depth: Neither provide detailed insights into user behavior nor allows digging deeper into granular data
Ideal use cases:
Best suited for established organizations looking for high-level visibility into performance and key business metrics.
Primary users:
Executives, business analysts, and department heads who rely on big-picture insights to guide planning and strategy.
Product Analytics
Definition and focus:
Product analytics focuses on understanding how users interact with digital products, exploring both what users do and how they engage with different features. I’ve gathered a list of the top 5 product analytics tools that can help you dive into user behavior and engagement.
Key features
- In-depth User Behavior Tracking: This offers granular insights into user interactions and engagement patterns.
- Feature Utilization Analysis: Pinpoints which product features are most effective and frequently used.
Advantages & challenges:
- Enhanced User Experience: This directs improvements tailored to user preferences and behavior.
- Focused Product Development: Identifies areas for refinement, encouraging innovation and usability enhancements.
- Limited Scope: Traditional product analytics tools often concentrate only on in-product data, which can make it harder to connect insights to broader business goals. Trusted agentic analytics platforms, such as Mitzu, address this limitation by integrating product data directly with business metrics.
Ideal use cases:
Ideal for startups and digital-first companies that want to enhance user experience and optimize product performance.
Primary users:
Commonly used by product managers, marketers, UX designers, and development teams, and anyone who needs quick, data-driven answers to product questions.
Integrating Product Analytics with Business Intelligence in the Modern Data Stack
Data tools are evolving fast, and the Modern Data Stack is at the center of this shift. Choosing between Product Analytics and Business Intelligence (analytics) isn’t an either/or decision, it’s about combining both to understand your business. Product analytics delivers deep insights into how users interact with your product, while analytics provides a broader view of overall business performance and strategic direction. Together, they create a powerful, well-rounded, and data-driven decision-making framework.
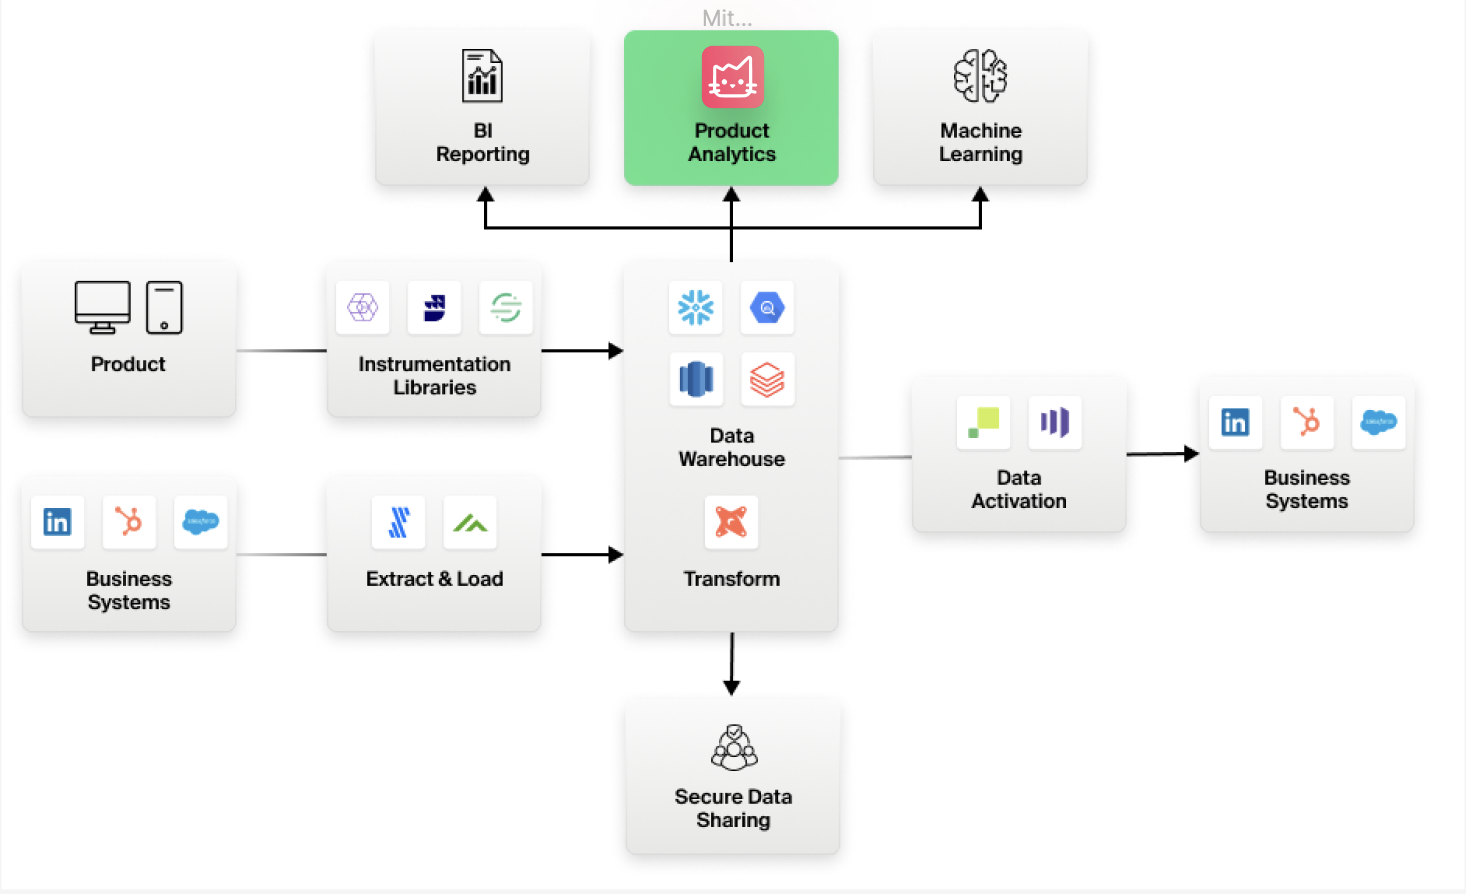
1. Cloud Data Warehouse
Everything starts with a cloud data warehouse like BigQuery or Snowflake, the single source of truth for all company data. Even data that used to sit in separate systems (like product events or IoT data) now lives here.
2. Composable CDP
Instead of one big monolithic platform, companies now use specialized tools connected through the warehouse:
- Instrumentation: Tools like Rudderstack or Segment capture customer data in warehouse-friendly formats.
- ELT: Fivetran and similar tools bring in data from business systems.
- Transformation: dbt cleans and structures raw data directly in the warehouse.
- Activation & Analytics: Teams use this data for marketing, product, and analytics, all without data ever leaving the warehouse.
This setup means fewer silos, tighter governance, and faster insights.
3. Mitzu’s trusted agentic analytics approach
Mitzu is built from the ground up for the Modern Data Stack. All computations run directly in your data warehouse, no data ever leaves it.
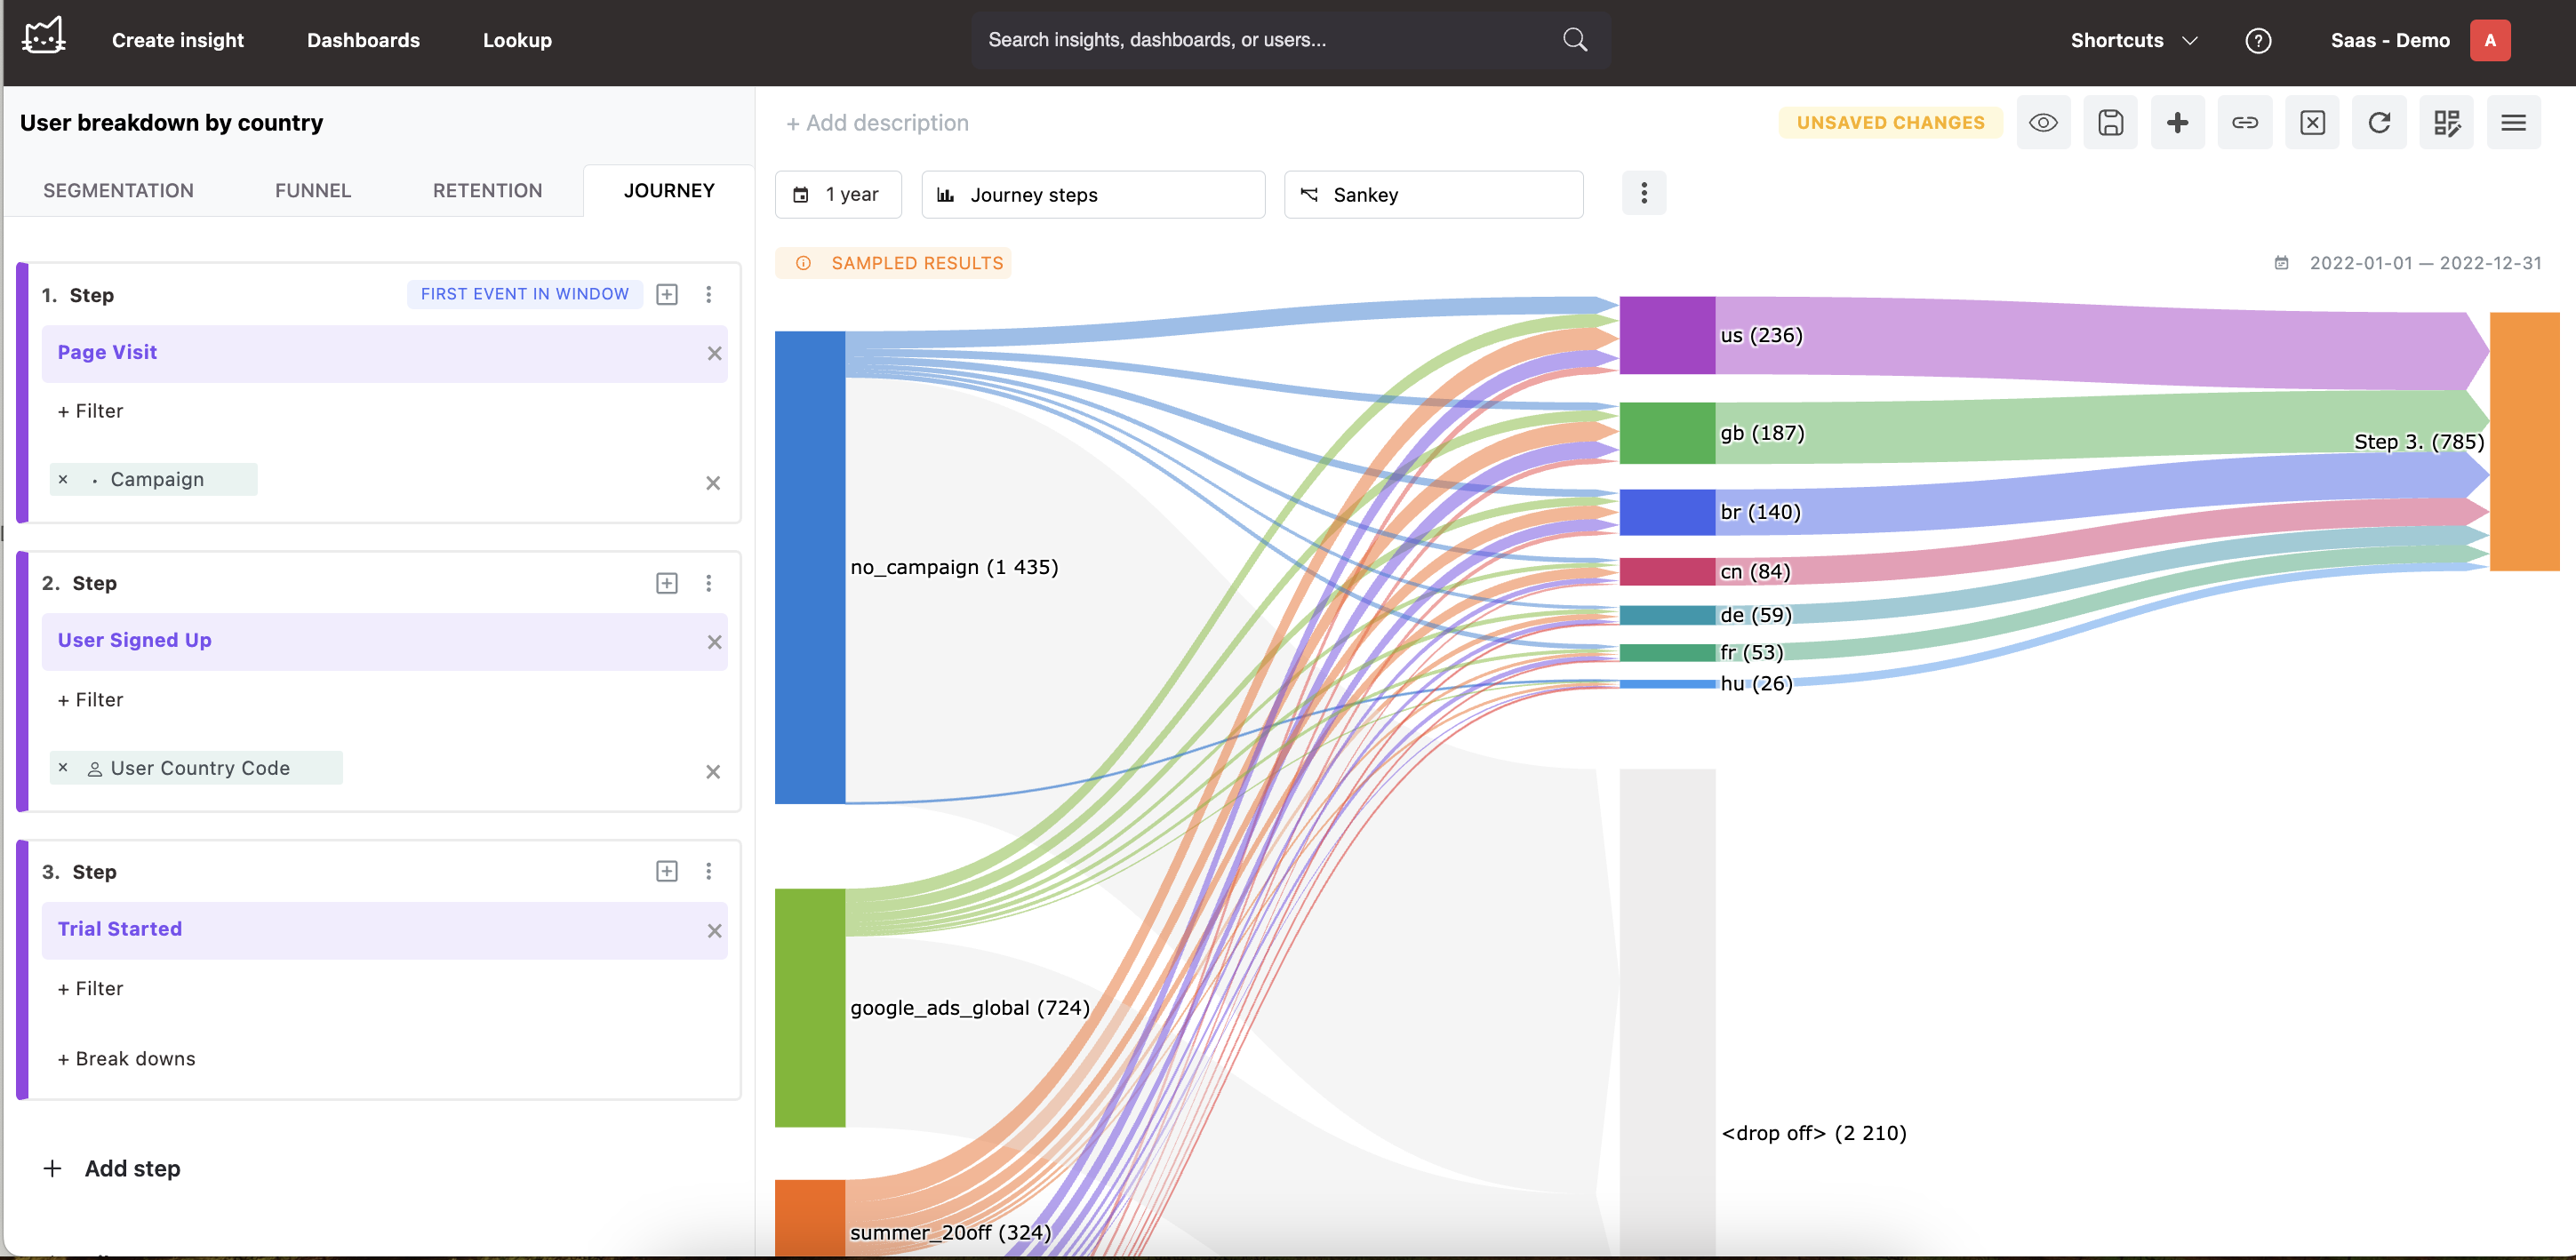
Our architecture bridges event-based and relational data, letting teams run both product and analytics-style analytics in one self-service tool. We use a relational foundation for flexible slice-and-dice analysis, layered with an event model for powerful product insights. Queries compile to optimized SQL, supported by our own query abstraction layer for top warehouse performance.
With Mitzu, analytics and product analytics live in a single tool reducing costs, improving governance and security, and removing analytics silos once and for all.
FAQ
Who is this guide for?
It is written for data, analytics, and product leaders who need practical framing—not generic tool hype—when modeling events, funnels, or warehouse access patterns.
What decisions does it help you make?
It highlights trade-offs around schema design, governance, self-serve access, and how analysis stays tied to the warehouse instead of a separate product silo.
Where should I go next for execution?
Pair this guide with your warehouse standards and a short evaluation of AI analytics agents that read the same governed models your BI stack trusts.